


Electricity consumption has always been regarded as the “vane” of economic operation, which can reflect economic trends in various regions to a certain extent. Recently, the State Grid released electricity consumption data for the top 100 cities in GDP in 2020. Combined with the previously announced data from various provinces, the country’s latest electricity consumption map is basically clear.
Which province and city uses the most electricity? Who uses electricity to grow the fastest? Who has the highest electricity consumption per unit of GDP? Behind these data are not unrelated to the differences in the industrial structure and production methods of various regions.
Who is the big power user?
Overall, among the provinces in the country, Shandong will consume 694 billion kWh of electricity in 2020, followed by Guangdong with 692.6 billion kWh, and Jiangsu ranks third with 637.4 billion kWh.
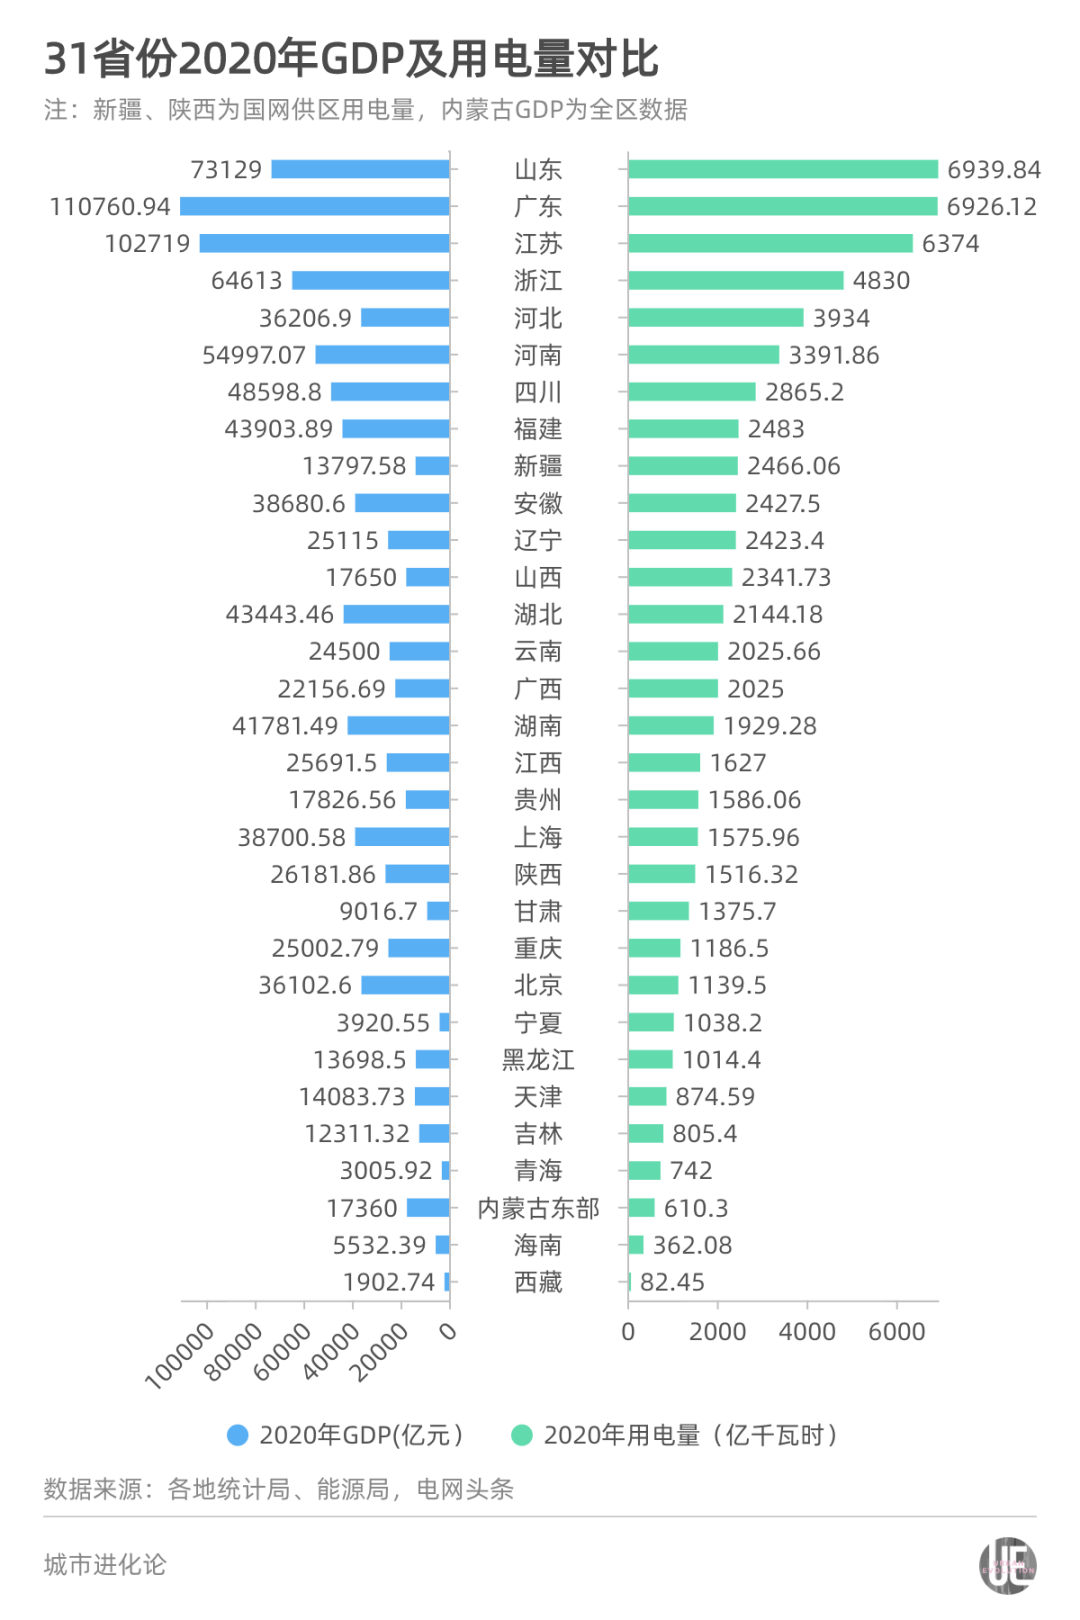
This is also the first time that Shandong has surpassed Guangdong and Jiangsu in recent years, jumping two places to the first in the country. Although the ranking has been adjusted, Guangdong Sulu, which consumes the most electricity, is still the three provinces with the largest economic volume in the country.
In 2020, Guangdong’s GDP exceeded 11 trillion yuan for the first time, ranking first in the country with 11,076,094 billion yuan for 32 consecutive years; Jiangsu’s GDP broke the 10 trillion yuan mark for the first time, ranking second with 10,271.9 billion yuan; Shandong’s GDP was 7,312.9 billion yuan, Ranked third.
It can be found that the difference in electricity consumption between Guangdong and Shandong is only 1.4 billion kWh, but the difference in GDP is more than 3,760 billion yuan, which is almost equivalent to the GDP of Hebei Province.
In addition, the electricity consumption of the whole society in Zhejiang and Henan both exceeded 300 billion kWh, ranking fourth and fifth in the country with 4830 and 339.186 billion kWh respectively.
In the 2020 National Urban Electricity Consumption List, Shanghai, Suzhou, Chongqing, and Beijing ranked the top four GDP top 100 cities with 1575.96, 1523, 1186.5 and 114 billion kilowatt-hour electricity consumption respectively.
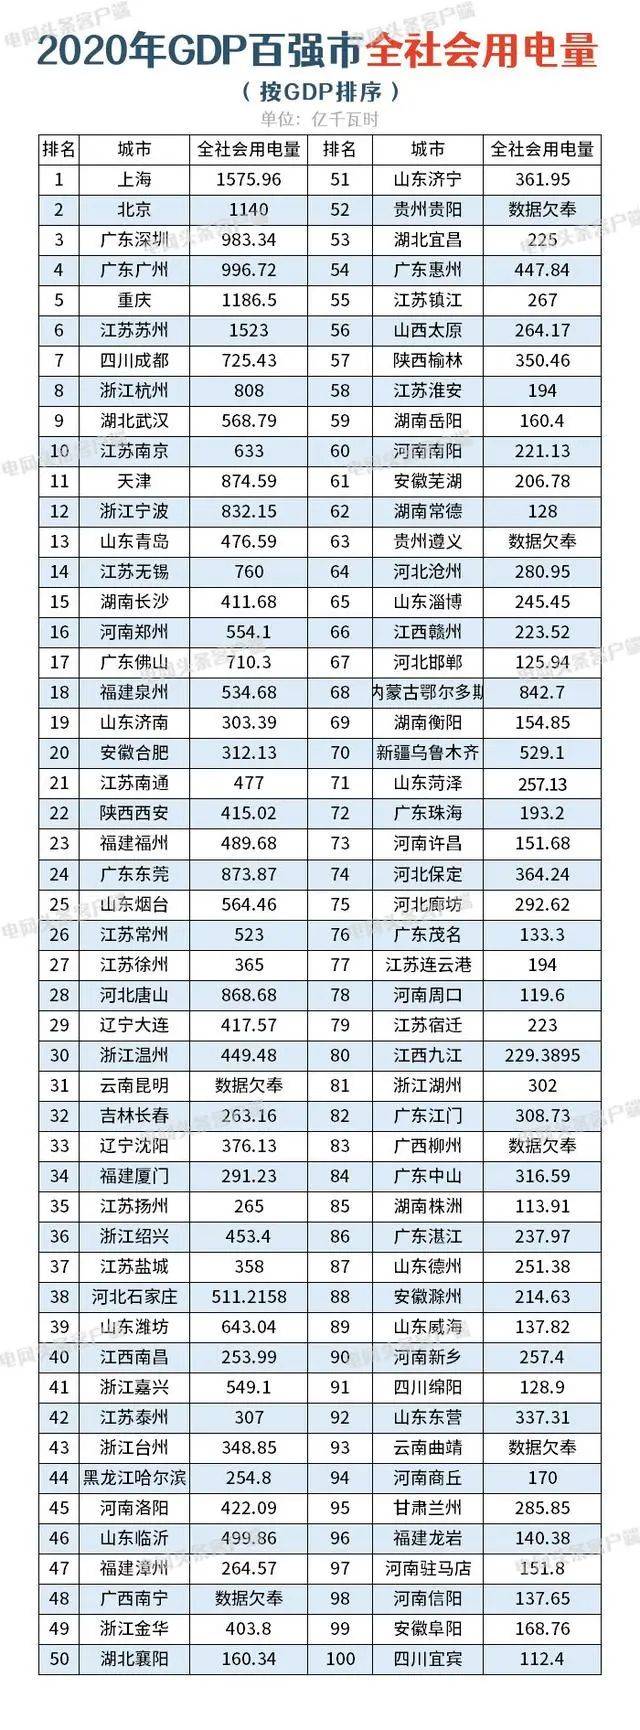
Except for the four cities mentioned above, the electricity consumption of the other top 100 cities in GDP has not exceeded 100 billion kWh.
Among them, Guangzhou, Shenzhen, Tianjin, Dongguan, Tangshan, and Ordos followed closely, ranking 5th to 10th in the country. Among them, the economically strong cities along the east coast and the traditional industrial cities in the north each account for half.
From the perspective of electricity consumption growth, a number of central and western provinces and cities have performed outstandingly.
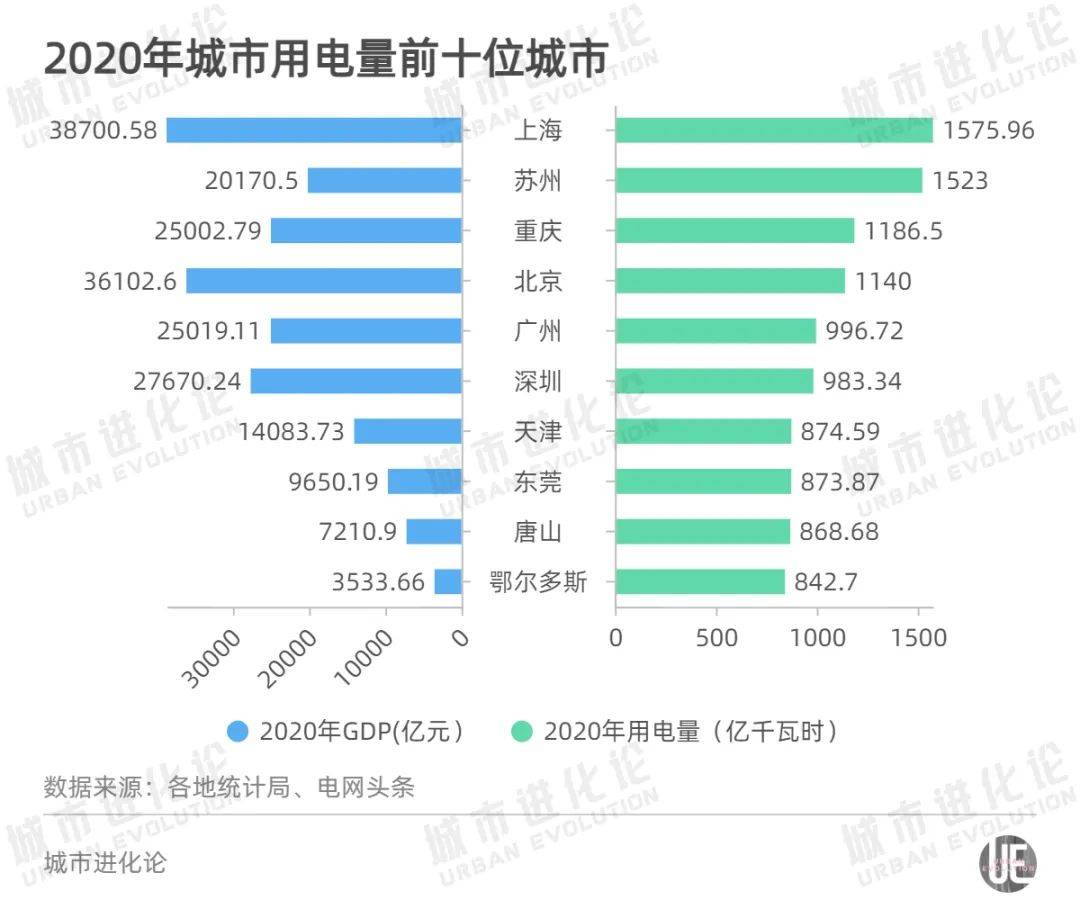
Data show that among the top ten cities in terms of electricity consumption growth, inland cities in the central and western regions occupy 7 seats. Among them, Erdos, Inner Mongolia, grew by 12.4%, ranking first in the country and 4 times the national average (3.1%).
The top ten cities in terms of electricity consumption growth. Source: Power Grid Headlines
In addition, the six cities of Chuzhou in Anhui, Mianyang in Sichuan, Yibin in Sichuan, Handan in Hebei, Yulin in Shaanxi, and Zhoukou in Henan also ranked among the top ten cities in terms of electricity consumption growth.
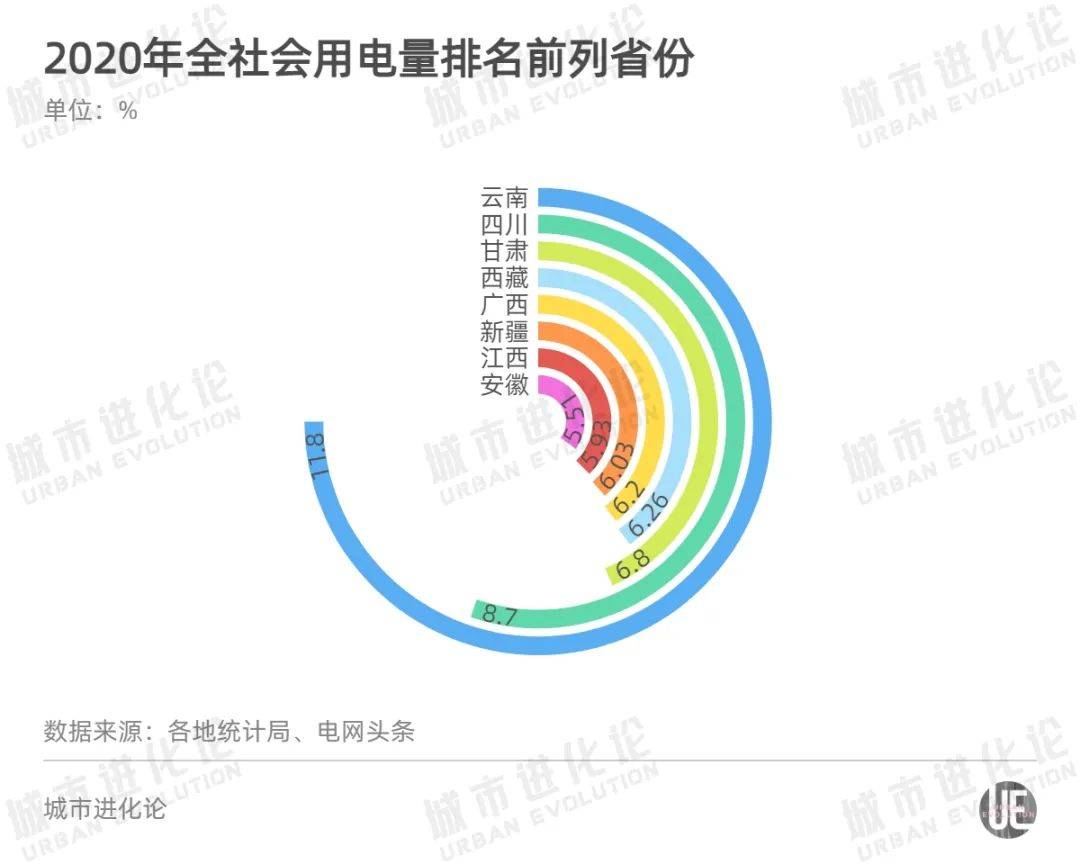
In terms of provinces, Yunnan, Sichuan, Guangxi, Gansu, Tibet, Xinjiang, Jiangxi, Anhui and other central and western provinces all achieved an increase in electricity consumption of more than 5% last year.
According to some opinions, due to the impact of the epidemic last year, inland cities were relatively less affected than eastern coastal cities with a higher proportion of export-oriented economies, and the growth rate of electricity consumption for economic operation was also greater than that of coastal areas. Big.
Whose power consumption contributes the most to GDP?
Electricity consumption is an important indicator close to the development of the real economy. The different rankings and trends of electricity consumption in each city actually reflect the differences in its industrial structure and even production methods to some extent.
Generally speaking, the output value of an industry is positively correlated with its electricity consumption. However, the GDP created per unit of electricity consumption in different industries has obvious differences, and different regions have different performance in terms of electricity consumption per unit of GDP due to their different industrial structures.
As can be seen from the above figure, the proportion of electricity consumed by the secondary industry in most cities is higher than the proportion of GDP contributed by it, and the tertiary industry is vice versa. In other words, the electricity consumption per unit GDP of the secondary industry is greater than that of the tertiary industry.
In terms of a province or city, the higher the proportion of the secondary industry’s GDP, the more electricity consumption per unit of GDP; conversely, the higher the proportion of the tertiary industry, the less electricity consumption per unit of GDP.
For example, Shandong surpassed Guangdong and Jiangsu in power consumption last year and ranked first, largely because of the difference in the degree of industrial restructuring in the three provinces of Guangdong, Jiangsu and Shandong.
According to the local statistical bulletin, in 2020, the proportion of Guangdong’s secondary industry will be lowered by 1.3%, the tertiary industry will be raised by 1%, the proportion of Jiangsu’s secondary industry will be lowered by 1.3%, and the tertiary industry will be raised by 1.2%. In contrast, the proportion of Shandong’s secondary industry was lowered by 0.8%, and the proportion of tertiary industry was raised by 0.8%, the smallest adjustment among the three provinces.
Look at the city again. In 2020, 23 trillion GDP cities will use nearly 23% of the country’s electricity and contribute 37.7% of the country’s GDP. In these cities, most of the tertiary industry accounts for more than “half of the GDP”.
Comparing carefully, there are some obvious deviations.
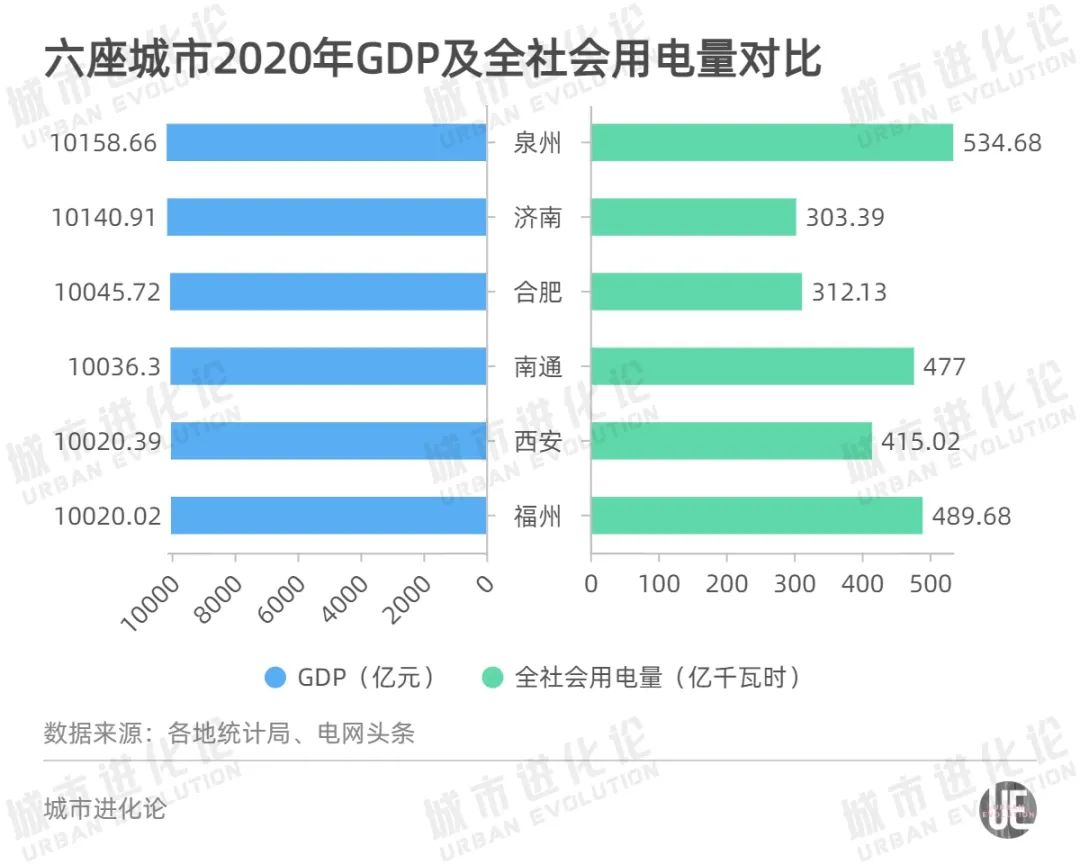
For example, in the six cities of Quanzhou, Nantong, Fuzhou, Xi’an, Hefei, and Jinan that have just entered the trillion-dollar club, Quanzhou with the highest GDP is 1.01 times the lowest, Fuzhou, but Quanzhou with the highest electricity consumption is 1.76 times the lowest Jinan.
The electricity consumption of Suzhou and Shanghai is almost the same, but the GDP gap between the two is as high as 1.8 trillion yuan-in 2020, Shanghai’s GDP will be 3.870.058 billion yuan, and Suzhou’s GDP will be 2017.05 billion yuan.
This involves the difference in electricity consumption per unit of GDP for each city.
Take two typical representatives of Suzhou and Beijing as examples-the latter’s electricity consumption per 10,000 yuan of GDP is less than half of the former.
The data shows that Suzhou’s secondary industry uses 85.56% of the entire industry’s electricity, contributing 46.53% of GDP; Beijing’s tertiary industry uses 64.68% of the entire industry’s electricity, contributing nearly 83.87% of GDP.
Obviously, a city with a higher proportion of the tertiary industry consumes less electricity per unit of GDP. It can also be said that the conversion of electricity consumption into GDP is more efficient.
However, on the whole, thanks to the rapid development of the tertiary industry and the continuous optimization of the manufacturing structure in various regions, the decline in the proportion of high-energy-consuming industries, and the gradual increase in the proportion of high-end manufacturing industries, most cities with trillions of GDP consume per unit GDP. Electricity is showing a downward trend.
Take Suzhou as an example. Since its first entry into the trillion-dollar club in 2011, its electricity consumption per unit of GDP has dropped from 1060.6 kWh/10,000 yuan to 756.8 kWh/10,000 yuan in the past 10 years. In the industrial manufacturing industry, there are six high-energy-consuming industries. The proportion of industrial electricity consumption has dropped from 49% in 2011 to 41% in 2020.
Which industries have seen a rapid increase in electricity consumption?
With the normalization of epidemic prevention and control and the acceleration of 5G commercialization, the online economy ushered in explosive growth last year. This trend is also directly reflected in the industry performance of electricity consumption.
According to the data, in 2020, the industries with the highest growth rate of electricity consumption by 19 provincial power companies in the State Grid supply area are “information transmission, software and information technology service industries”, and electricity consumption for base stations and Internet services And other categories are included.
As an important construction content of “new infrastructure”, the growth rate of electricity consumption in the “charge and swap service industry” is also eye-catching-almost all state grid supply regions, provinces (districts and cities) in this industry are experiencing rapid growth in electricity consumption.
Image source: Photograph
So, which provinces and cities are growing most rapidly?
In terms of provinces, Sichuan’s “information transmission, software and information technology service industries” and “Internet and related industries” both ranked first in power consumption growth, increasing by 75.72% and 125.32% respectively. Among the growth rates of electricity consumption in its manufacturing industry, the growth rate of “computer equipment manufacturing” ranked first, reaching 43.38%.
In fact, as Sichuan’s first trillion-level industry, electronic information has maintained a good momentum in recent years.
According to data from the Sichuan Provincial Department of Economy and Information Technology, in 2020, the electronic information manufacturing industry above designated size in Sichuan will achieve operating income of 695.75 billion yuan, a year-on-year increase of 28.1%. The total volume ranks fourth in the country, and the growth rate is the first among the top four provinces. .
From the perspective of cities, among the trillions of GDP cities, 18 cities have achieved double-digit growth in electricity consumption in the “information transmission, software, and information technology service industries”, and 14 cities have achieved the highest growth rate in this industry (excluding Guangzhou, Guangzhou, Shenzhen, Quanzhou, Foshan).
Among them, the performance of cities in the Yangtze River Delta is particularly outstanding-Nantong increased by 73.31%, Suzhou by 47.95%, Shanghai by 31.54%, and Wuxi by 30.1%.
When contracting with major economic indicators, there are also some unexpected electricity consumption data.
For example, in the “accommodation and catering industry”, despite the negative growth of electricity consumption in most areas of the country, there are still some provinces that achieved contrarian growth last year.
According to the data, the electricity consumption of Henan’s “accommodation and catering industry” increased by 5.88%, taking the first place in the “king of dry rice” in 2020. Qinghai, Tibet, and Gansu ranked among them with growth rates of 4.59%, 1.63%, and 0.46%, respectively. Rear.
This article is transferred from: Daily Economic News


You must log in to post a comment.