


Zhang Yaoxi: Gold bulls still show difficulties, look at terror data under inflation
Last trading day Thursday (May 13): International gold London Gold further set a weekly low and then rebounded to close.
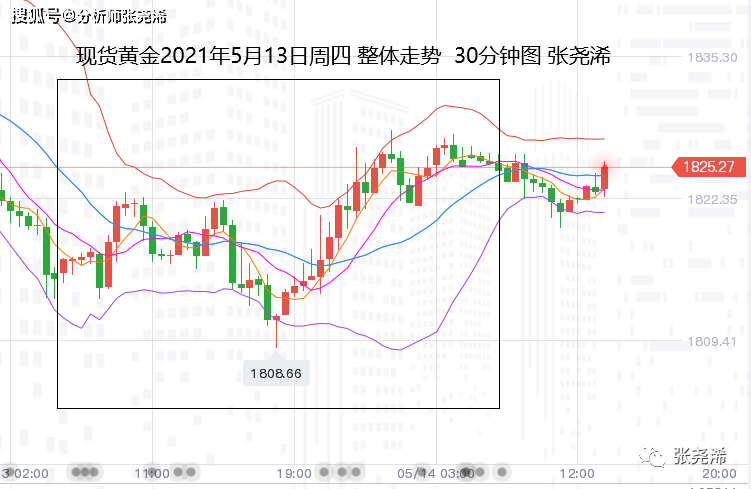
On the trend, the price of gold since the Asian market in early trading Opened at 1815.85 The US dollar per ounce fluctuated around 1818 US dollars as a whole. During the European session, the market broke the turbulence range and touched below the given short order target of 1809 US dollars, which means it was recorded. Intraday low 1808.56 U.S. dollar
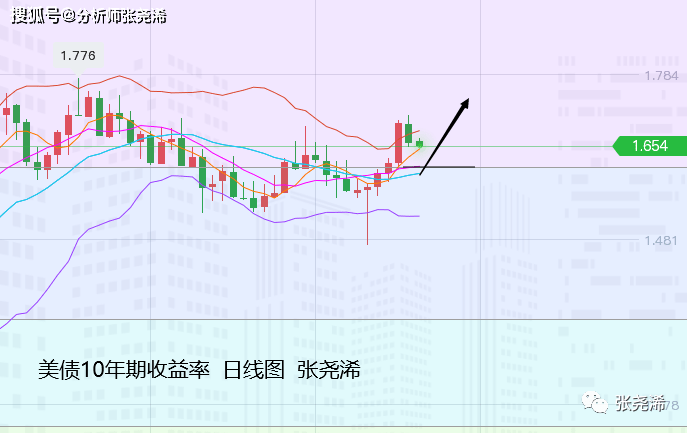
After that, the price of gold hit the bottom and rebounded continuously and continued to the U.S. market. Although the initial data was negative for gold prices, after a brief decline, the trend rose again. The producer price index (PPI) in April was stronger than expected, which further proves Inflation in the United States is heating up to support gold prices.In addition, the U.S. dollar out of turbulence and U.S. Treasury yields closed down, which provided impetus to gold prices and recorded Intraday high 1828.38 The U.S. dollar has met resistance, and eventually Closed at 1826.28 Dollars, The daily amplitude was US$19.82 and closed up US$10.43, an increase of 0.57%.
Looking forward to today’s Friday (May 14): International gold was under pressure at the opening, and the 5-day moving average created selling pressure on it. The lower U.S. index and U.S. bonds did not significantly support gold prices.
The market is still waiting for the evening’s horrible data. US retail sales data. If the data is strong, gold may be under pressure. However, according to the expected value, it is expected to have greater support for the gold price. In addition, the recent strong performance of the data is a cause The price of gold falls first and then rises. Therefore, regardless of the results of the data, the price of gold has room to rise. Therefore, pay attention to the first direction after the data is released, and the specific operations and ideas are subject to the actual warehouse information.
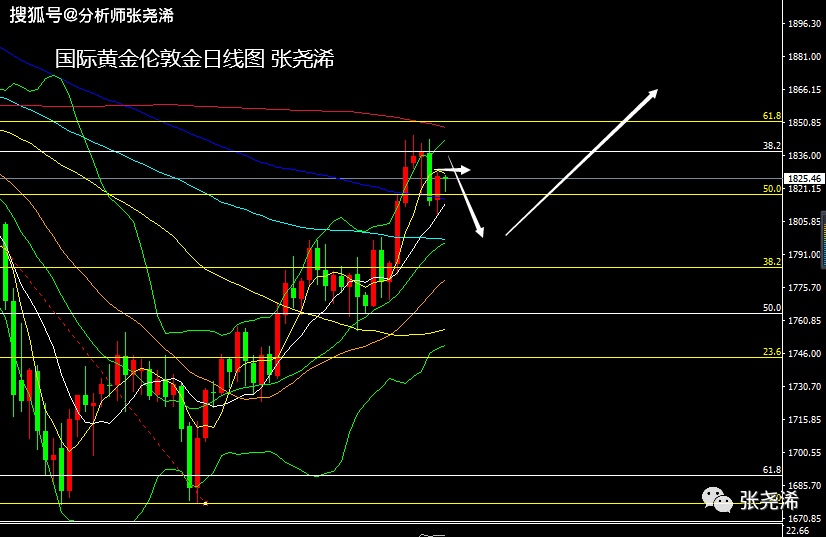
Recently, after the gold price recovered from resistance near the 200-day moving average, it fell below the 50% Fibonacci retracement level of the January-March decline, which is about $1818. Although it is still running at the top of the market, the market’s expectation of a fall is still there. We do not rule out the risk of falling below again. According to its movement, the price of gold will basically rebound and break beyond the upper track, and test the fall on the 10th and The mid-rail support has now returned to the 10-day line, but the upward pressure is still expected, and the 5-day line is also under pressure in the day. Therefore, there is a high probability that the market will go further down to test the mid-rail support position. That is the $1798 mentioned in the title yesterday. However, the lows at the end of April and the beginning of May provided direct support for the price of gold near $1,800. Therefore, while hitting the expected low support, it is also an opportunity to seize the rebound first.
Prior to this, the US Consumer Price Index (CPI) released on Wednesday last month set the largest increase in nearly 12 years, intensifying people’s concerns about rising inflation and possible interest rate hikes. At the same time, the higher-than-expected PPI increase in April yesterday also intensified inflation. All inflation data had a positive impact on the price of gold. However, relative to the period of high inflation, gold performed poorly.
In addition, although Fed officials have stated that they will continue to maintain easing policies and U.S. bond yields have declined, the recent escalating conflict between Palestine and Israel is also expected to provide some momentum for safe-haven gold.
However, the strength of the stock market and the decline in the number of initial jobless claims have restricted the rise of gold prices. SPDR gold holdings have decreased for the first time after three consecutive days of no change, indicating that the market still has doubts about the strength of gold. In general, the Fed and Biden’s easing policies continue to boost gold prices, while market concerns about excessive inflation and the panic of monetary policy tightening will drag down gold prices. After entering the second half of the year, with the continuous increase in debt reduction and interest rate hike expectations, the trend of gold may become more and more difficult. The short-term direction is more difficult to judge.
Technically:
Daily level: The price of gold stopped falling and rebounded on Thursday supported by the 10-day moving average. Today Friday, it was under pressure under the pressure of the 5-day moving average. However, the 10-day moving average will continue to produce buying support in the day’s white trading and come out of the rebound. However, in terms of the indicators in the attached drawings and the pressure of the main chart, the personal bias once again fell below the 10-day moving average position. According to the previous blockade of the 100-day moving average, the market rebounded again after the retracement hits the middle track. Looking at the current strength, the market has suffered. The pressure on the 200-day moving average will also fall and touch the support of the middle rail. Therefore, while optimistic about the position of the 10-day moving average support, we should also pay attention to the support near the middle rail;
International Gold: Follow above 1828 Resistance near the dollar, and 1835 Near the US dollar; follow below 1815 Near the dollar, and 1809 Support near the dollar, pay more attention 1798 Support near the dollar;
Silver TD: Follow above 5600 Yuan/gram resistance, and 5650 Yuan; follow below 5500 Yuan/kg, and 5455 Yuan/kg;, further attention 5390 yuan.
Shanghai Bank 2106: Follow above 5630 /Kg resistance, and 5675 Yuan/kg resistance.Follow below 5490 Yuan/kg support, and 5430 Meta support
Note:
Gold TD = (International Gold Price x Exchange Rate)/31.1035
International gold fluctuates by 1 US dollar, and gold TD fluctuates by about 0.22 yuan (in theory).
US gold futures price = London spot price × (1 + gold swap interest rate × futures maturity days / 365)
Make bold predictions and trade with caution. The above opinions and analysis only represent the author’s personal thoughts, and are for reference only and not as a basis for trading. According to this operation, you will be at your own risk.
Essential Books for Fundamentals of Gold Investment: “Play and Earn Gold Investment Transactions”


You must log in to post a comment.